Download .mup .muz Plot Configurator files
Steps to create your own files:
1.1 Open a new part using menu File–>New.
1.2 Set the Design Mode as “Part Design”, Unit as “mm” , Drafting Standard as IS and enter Part Name as “solid_cone”. CollabCAD window pops up on the screen and press F to fit into screen so that XY plane is displayed.
1.3 Set the view to top. Goto View–>Top or press Ctrl + T. Press F to fit into screen.
1.4 Goto menu Basic–>Arc->Center & Point and specify the center as origin. To specify center activate mouse right click and select Workspace Origin from the displayed option.
Press T to give radius input.
Radius : 25
A circle is displayed on the screen.
1.5 Change the view to Isometric using menu View–>Isometric or press Ctrl + \ key.
1.6 Press F to fit into screen.
1.7 Go to menu Solids–>Cone–>Base Circle.
Select the base circle, dialog box pops up on the screen and enter
Length : 50
Top Radius : 0
and then press OK
1.8 Press F to fit into screen. Now cone is displayed on screen
1.9 Go to menu Edit–>Blank–>Type. Blank dialog box pops up on the screen select curves option and press OK.
1.10 To change the display mode option goto menu Tools–>Options–>Sessions and select Shading tab. Set the following options from combo box.
Method : Gouraud
Transparency : Proportional
Display : Hidden Line Removal
Quality : Refined (set the slide bar to left most corner for better display quality)
1.11 Now a solid cone is ready. Press “S” to shade “R” for wire frame display.
1.12 Save the part as solid_cone.muz using menu File–>Save As. A File Chooser dialog box will appear that shows the files in the default path. If user prefers , he can save the part in different folder..
Creating 2D Projection Views using Plot Config:
1.13 Go to menu File–>Plot Configurator and the 2D plot config application window is displayed on the screen.
1.14 Close the Symbol Pallet.
1.15 Before creating 2D projection views make the following settings.
1.16 Go to File–>Page Setup and a dialog box will pop up. Select Paper Size as “A4” & Orientation as “Landscape” and Paper Width & Height are set automatically.
1.17 Go to Tools–>Options and plot options dialog box will pop up. Select display Type as “Hidden Line Removal”, Scale as “1:2” , click View Border and uncheck View Movement Constrained check box under general tab. If needed user can set filters by blocking the type of entities like point, curve etc in plot config.
1.18 Maximize plot config application to full screen by dragging along the top or bottom corner.
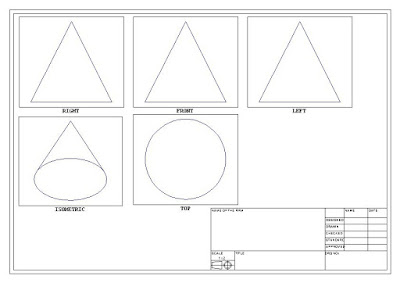
1.19 Go to View–>Standard Select layout dialog box will pop up. Select “First Angle 4 Views” projection from combo box and four projection views right side, front, left side and top view are displayed on the screen.
For getting isometric view Goto View–>Select, view dialog box will pop up. Select the required view from combo box and drag on the plot config screen.
1.20 View border can be increased by dragging along horizontally or vertically. Go to View–>Modify and place the mouse near to view border and the cursor position will change to drag arrow symbol automatically.
Or
Go to View–>Scale and a dialog box will pop up. Specify the Rect Width & Rect Height as per requirement so that view borders of all views are modified uniformly.
1.21 The individual views can be moved within its view border. Goto View– >Modify & press Ctrl key and drag the desired view within the view border. ( All 4 views will move together if View Movement constraint check box not unchecked under Tools->Options->General in step no 1.17) . The unnecessary views can be deleted by using menu View–>Delete and selecting the particular view.
1.22 To show the Axis Line go to Dimensions –>Symbols –>Axis line. For first point for center line select point just above center of view in a view box and for second point select point just below center of view.
1.23.To show the Axis Line in Top view go to Dimensions –>Symbols –>Centre Line-Point and select centre of the circle and an outside point of circle.
1.24 Save the plot as solid_cone.mup using menu File–>Save As. A File Chooser dialog box will appear that shows the files in the default path. If user prefers , he can save the plot in different folder.
Sign up here with your email

ConversionConversion EmoticonEmoticon